
Performance testing is critical for understanding how applications behave under different levels of load, but interpreting the results remains a complex challenge. Traditional evaluation methods—especially those using binary pass/fail criteria—fail to capture the nuanced reality of modern software systems. As part of Continuous Integration and Continuous Deployment (CI/CD) pipelines, performance tests must provide actionable, reliable insights without manual intervention.
In this post, I’ll share my insights on evaluating performance testing results. It’s the first part of a series aimed at achieving fully autonomous continuous performance testing.
Why Evaluation Is Critical for CPT and Performance Testing
Performance testing is no longer a one-time activity executed before release. With Continuous Performance Testing (CPT), performance checks are embedded throughout the software delivery lifecycle. This integration demands fast, reliable decision-making. But performance data—response times, error rates, throughput, resource utilization—are inherently noisy and multidimensional.
In CPT:
- Time is limited. Tests must run and be evaluated quickly.
- Automation is mandatory. Manual interpretation won’t scale with frequent code changes.
- Confidence is key. Developers need to trust that test results reflect true system behavior.
Therefore, the evaluation process must be intelligent, automated, and resilient to variations in system and workload.
What is Thresholds
Thresholds are the specific values that determine whether a test passes or fails by establishing the minimum or maximum acceptable performance levels. In the context of performance testing, these thresholds are particularly significant because they serve as the benchmark against which test outcomes are measured. By comparing the actual test results to these predefined thresholds, testers can objectively decide whether the system meets the required performance standards or falls short.
 |
| Setting Static Threshold for K6 |
Consequently, setting appropriate thresholds is a critical step in the testing process. These values must be carefully determined, either by analyzing historical data and performance expectations or by calculating them based on the anticipated capabilities of the system under test. This ensures that the thresholds accurately reflect the desired performance goals and provide a reliable basis for evaluating test outcomes.
Thresholds can be established using two distinct approaches:
- Static threshold setting
- Dynamic threshold setting.
Static thresholds use predefined fixed values, requiring extensive optimization, while dynamic thresholds adjust in real-time based on system behavior analysis. Static methods offer consistency but lack flexibility; dynamic methods adapt but add complexity. Both pose technical challenges, and the choice depends on testing requirements.
The Problem with Static Thresholds
Performance tests often rely on static thresholds to determine pass/fail criteria—for example:
- Response time must be below 500 ms
- Error rate must stay under 1%
- Throughput should exceed 1000 requests per second
Although straightforward to implement, static thresholds face significant challenges. Analyzing complex systems makes threshold-setting difficult, as performance baselines are rarely static. Additionally, evolving codebases and infrastructure require constant adaptation, rendering fixed values impractical over time. Dynamic adjustments may be necessary, but they introduce their own complexities. While easy to implement, static thresholds have major limitations:
- Rigidity: Static thresholds do not adapt to changes in workload, system architecture, or infrastructure. A fixed “500 ms” limit might make sense in one deployment but fail arbitrarily in another with slightly different characteristics.
- Binary Results: The system either passes or fails, without any contextual interpretation. A 501 ms response time is marked as failure, even if performance is functionally acceptable.
- False Positives and Negatives: Minor fluctuations or outliers may cause test failures despite overall system health, or hide genuine regressions if averages remain within bounds.
- Lack of Learning: Static thresholds don't improve over time. They remain detached from historical behavior, usage patterns, and test results, which creates missed opportunities for smarter evaluations.
Evaluation Methods for Performance Testing Results
To overcome the limitations of static rules, performance engineers use several evaluation techniques, typically falling into three categories:
1. Static Thresholds
The most basic form of evaluation. Simple rules are defined ahead of time, often as configuration in CI pipelines or monitoring dashboards. Setting static thresholds for performance testing involves defining fixed limits for key performance metrics (e.g., response time, throughput, error rate) to determine whether a system meets acceptable performance standards.
- Pros: Easy to implement, understandable for most of the system, but sometimes hard to set the correct values for complex systems. Performance requirements can be directly used if it is already defined.
- Cons: Too simplistic, brittle, prone to false alarms.
- Best Use: It can be used for quick checks for very stable systems with well-known characteristics.
2. Statistical Methods
These methods treat performance metrics as distributions rather than fixed numbers. They leverage hypothesis testing, standard deviation, and confidence intervals to determine whether current performance deviates significantly from historical norms.
 |
| Using Normal-Distribution |
For example: Test whether the 95th percentile response time is within two standard deviations of the historical average. Use confidence intervals to detect regressions even if values remain under hard thresholds
- Pros: Adaptive, contextual, data-driven
- Cons: Requires more data and expertise, sensitive to anomalies. Need to be careful that there might be a trend that every run goes up in the confidence level, so the hypothesis does not fail.
- Best Use: Detecting subtle performance regressions or anomalies in CI pipelines
3. Machine Learning Models and Using AI
ML models offer the most advanced and flexible approach. By learning from large amounts of historical data, these models can classify test outcomes, detect anomalies, and even forecast future performance.
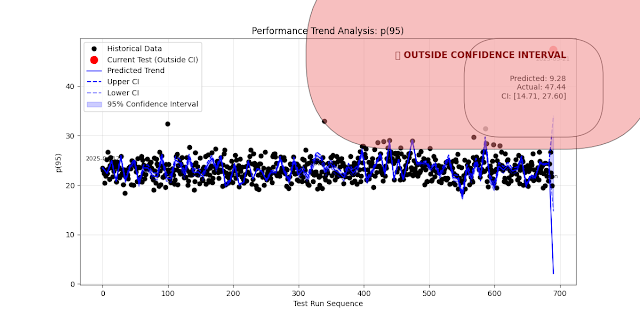 |
| Using ML model for Trend Analysis |
ML-based evaluation can be applied using:
- Supervised learning: Train a model to label runs as “pass” or “fail” based on historical test outcomes and associated metrics.
- Unsupervised learning: Use clustering or anomaly detection to highlight unusual behavior without labeled data.
- Forecasting: Predict future performance trends using time series models (e.g., LSTM, Prophet).
- Pros: Scalable, context-aware, adaptable to change
- Cons: Requires sufficient data, infrastructure, validation, and expertise
- Best Use: High-frequency testing environments, dynamic systems, exploratory analysis
Conclusion
The evaluation of performance testing results is one of the most crucial—and most misunderstood—parts of modern testing pipelines. As software systems grow more complex and dynamic, simplistic evaluation techniques no longer suffice.
- Static thresholds offer quick wins but struggle with accuracy and adaptability.
- Statistical methods introduce nuance and data-driven judgment, ideal for detecting meaningful regressions.
- Machine learning opens the door to scalable, intelligent, and autonomous performance evaluation.
To support CI/CD and shift-left strategies, evaluation mechanisms must evolve to be as dynamic and intelligent as the systems they monitor. The future of performance testing is not just about generating metrics—it’s about understanding them in context, automatically, and with confidence.